Mastering Outbound Sales KPIs: Your Key to Success [3 free templates inside]
Outbound sales efforts can be overwhelming, and without proper measurement, they may end up draining your resources. Measuring outbound sales KPIs is crucial to avoid these kind of challenges. Meaning – you need solid data to support your decisions.
This is where Key Performance Indicators (KPIs) become critical for sales managers and founders (who are the sales managers at early-stage start-ups, most times) to measure the success of their sales team and make data-driven decisions.
However, tracking outbound sales KPIs can be a complex and challenging task that requires addressing several pain points. Data accuracy, consistency, and integration are just a few of the challenges that sales managers and founders must overcome when tracking their sales team’s KPIs.
In addition, staying up-to-date with the latest metrics, dedicating sufficient time to tracking, and ensuring adoption among the sales team can all pose significant challenges.
In this article, we’ll cover the various categories of KPIs that a sales manager or founder should measure to get actionable insights for their sales team to perform effectively.
You will find 3 free sales KPI templates that you can utilize to kick off your sales measurement efforts.
Let’s get started.
Lead Generation KPIs
- Lead volume
- Lead conversion rate
- Lead response time
- Lead Quality Score
Lead generation KPIs refer to metrics that assess the success of your sales team’s efforts in attracting and nurturing potential customers, commonly known as leads.
As a sales manager, tracking these KPIs is essential in gaining valuable insights into the efficiency and effectiveness of your sales process, as well as the quality of leads generated.
You can gain a deeper understanding of which campaigns and tactics are generating high-quality leads, identify areas for improvement in your lead generation process, and adjust your strategy accordingly.
So, tracking lead generation KPIs is an important aspect of managing a sales team and achieving success in today’s competitive sales environment.
Here are some major KPIs that you consider tracking in lead generation –
1. Lead Volume
Lead volume is a lead generation metric that measures the number of leads generated by a company over a given period.
Formula: Total number of leads generated in a specific time frame, for example, per day, per week, per month, or per quarter.
Enterprise companies typically track lead volume on a monthly or quarterly basis, but for early stage start-ups and SMBs, tracking this metric weekly can be more advantageous.
By tracking lead volume on a weekly basis, you can monitor their lead generation efforts more closely and respond quickly to any changes in lead generation performance.
For example, if a company sees a sudden increase in lead volume, it could indicate the success of a recent sales campaign or the effectiveness of a new lead generation strategy. On the other hand, if lead volume decreases, it could indicate that the company needs to adjust its lead generation tactics to better attract leads.
Of course, it depends on the quality of the lead as well. This brings us to the next KPI – Lead quality score.
2. Lead Quality Score
Lead quality score is a measure of the potential value of a lead in terms of becoming a customer.
Formula: formula for lead quality score can vary depending on the company and the specific factors they use to determine the potential value of a lead.
However, some common factors that can be used to calculate lead quality score include the lead’s job title, industry, company size, budget, and level of interest in your product.
Example:
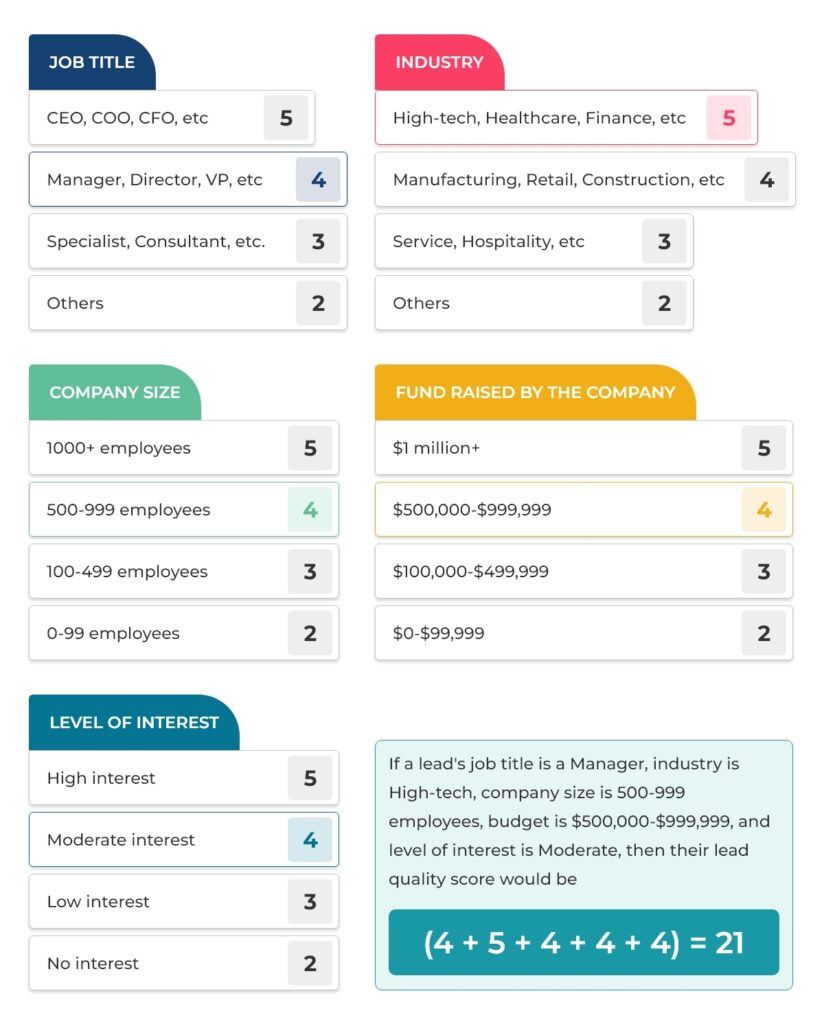
This lead quality score indicates that this is a relatively high-quality lead. By focusing on high-quality leads, sales teams can increase their chances of closing deals and achieving their sales goals.
Benchmark:
- 20 quality leads per month generated by the sales team (According to Operatix)
3. Lead Response Time
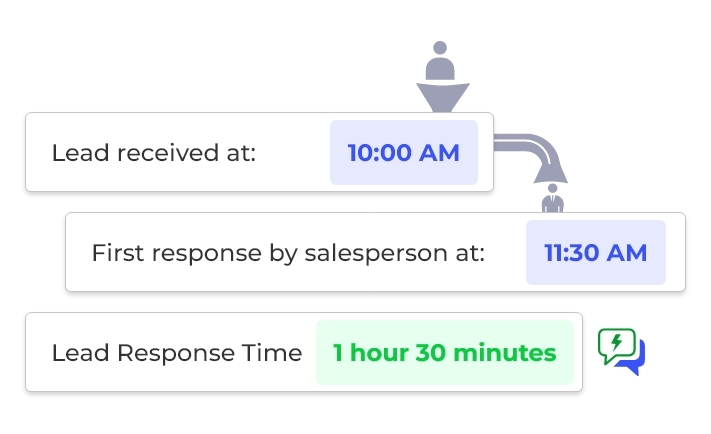
This measures the amount of time it takes for a salesperson to respond to a new lead after they receive it. This metric is important because it provides insight into how quickly the sales team is responding to new leads and engaging with potential customers.
A prompt response time can help increase the chances of converting leads into customers, as it shows that the company is attentive and interested in doing business with them.
On the other hand, a slow response time can signal disinterest or neglect and may result in lost opportunities.
Formula: Lead received time – Salesperson’s first response time
This can be calculated in minutes, hours, or any other desired unit of time.
Example:
Benchmark:
- According to a survey conducted by Harvard Business Review, the average response time that an SDR takes is 42 hours.
It’s crucial to have this number even less because if you run a sales team of a thriving start-up, you have to be proactive with the leads you generate.
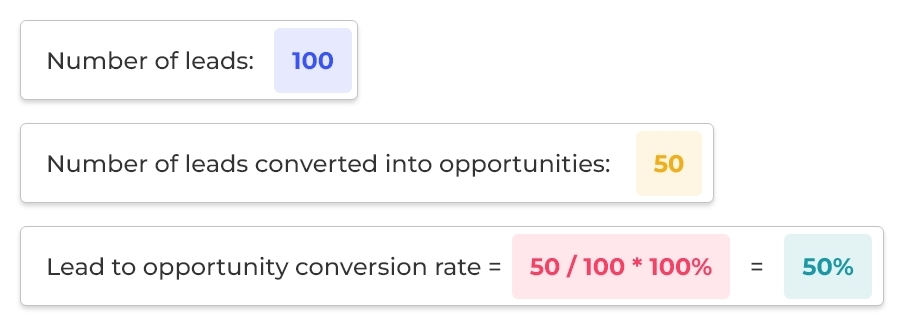
4. Lead to Opportunity Conversion Rate
This metric measures the percentage of leads that are converted into potential opportunities.
It is a potential KPI for sales managers to identify any bottlenecks in the sales process and make necessary improvements to increase the rate of successful conversions.
Formula: (Number of opportunities created) / (Total number of leads) * 100%
Example:
Benchmark:
- Average lead to opportunity conversion rate for SaaS companies is 12% (Source: OpenviewPartners)
Sales Productivity KPIs
- Activities
- Opportunities created
- Proposals sent
- Deals closed
Every SDR’s daily chores revolve around prospecting and reaching out to these prospects via different communication channels like email, call, social platforms, etc.
Sales productivity KPIs provide a detailed view of how sales reps are spending their time around these daily activities, how many opportunities they are creating, and how many deals they are closing.
1. Activities
Tracking the quantity of sales activities completed by each representative within a specific time period can provide insights into their level of productivity. Some of the major metrics you might consider measuring:
- Emails sent = Total number of emails sent
- Opens = Total number of opens
- Number of clicks = Total number of clicks
- Number of replies = Total number of replies received
- Number of positive replies = Number of positive replies
- Number of meetings scheduled = Total number of meetings booked
- Calls = Total number of calls made
Benchmarks:
- Emails sent: 10-40 emails per day, according to The Bridge Group’s SDR Metrics Report with Benchmark data from 406 B2B companies.
- Calls made: 40-50 calls per day (Source: Operatix)
- Reply rate: Most cold emails get a 1% to 5% reply rate (Source: GMass); 12% reply rates for effective sequences (Source: Outreach)
- Meetings scheduled: Outbound SDRs produce 15 meetings a month, with an 80% show rate, leading to 12 meetings held per month (Operatix)
2. Opportunities Created
This is the number of potential sales leads that a salesperson has identified and moved into the pipeline.
Sales efforts are meaningless unless they result in substantial growth in the sales pipeline. This is a major metric, especially for a founder who’s also a sales manager in a start-up environment, because It helps to assess the salesperson’s ability to find new business and expand the customer base, which is crucial for the growth and success of the company.
Formula: Total number of new sales opportunities created by a sales rep on a daily, weekly, or monthly basis.
Tracking these metrics on a weekly basis provides a more frequent and up-to-date view of a sales rep’s performance, which can be especially important for early stage start-ups that are rapidly growing and need to make informed decisions quickly.
Benchmark:
- According to TOPO’s Sales Development Benchmark report, 58% of SDR-qualified leads end up as opportunities.
3. Proposals Sent
Proposals sent metric refers to the number of proposals or quotes that a salesperson has sent to potential customers.
Tracking the number of proposals sent can provide insight into the efficiency and effectiveness of SDRs in identifying qualified prospects and nurturing relationships, whether through their own efforts or by passing leads to the account manager.
This metric can help determine if SDRs are effectively generating SQLs and opportunities with a genuine interest.
Formula: Total number of proposals/quotes sent over a period of time (can be on a daily, weekly or monthly basis depending on your organization’s stage.)
4. Deals Won
Monitoring the amount of business generated by each sales rep in your team through their outbound efforts is important, even though an SDR doesn’t usually close deals in most sales teams.
This can assist in making informed decisions regarding budgeting and reinvesting in sales strategies.
Formula: Total number of deals won over a period of time (daily, weekly or monthly – depending on your organization’s stage)
Benchmark:
- Average close rate is 22% for B2B SaaS companies (Source: FreeAgentCRM)
Sales Performance KPIs
- Sales Conversion Rate
- Average Deal Size
- Win-Loss Ratio
- Sales Cycle Length
Sales performance refers to the overall success and effectiveness of a sales team in achieving their goals and targets.
It involves various aspects of sales such as pipeline management and tracking, deal closing and negotiation strategies, and sales forecast and quota tracking.
These components help sales managers and teams to assess and improve their sales efforts, ultimately leading to increased productivity and revenue growth.
1. Sales Conversion Rate
The Sales Conversion Rate is a metric that measures the percentage of leads that actually become customers.
Formula: (Number of deals won) / (Number of opportunities in the sales pipeline) x 100%
By tracking the sales conversion rate, a sales manager can ensure that they are effectively using their resources and that their sales strategy is working as intended.
Benchmark:
- 6% of sales-qualified leads (SQLs) turn into actual customers.

2. Average Deal Size
The average deal size metric is a measure of the average revenue generated from each successful sale or transaction.
Formula: Total Revenue from Sales / Number of Deals
This metric is important for sales managers because it provides insight into the average revenue generated from each deal, which can help them make informed decisions about pricing strategies, target markets, and sales tactics.
Benchmark:
- Average deal size is $504 of a product or service priced less than $1000. (Source: InsightSquared)

3. Win-Loss Ratio
The win-loss ratio measures the success rate of a sales team in terms of the number of deals won compared to the number of deals lost. This will give a clear picture of the effectiveness of a sales team in closing deals, and can help sales managers identify areas for improvement.
Formula: Number of Deals Won / Number of Deals Lost + Number of Deals Won
For instance, a high win-loss ratio of a sales team may suggest that they have accurately aimed at potential clients and applied successful sales techniques.
Conversely, a low win-loss ratio may indicate a requirement for enhancement in your sales approaches, methods of finding potential customers, or improvements in your products.
Benchmark:
- According to a survey conducted by RAIN Group Center for Sales training considering 472 sellers, the average win rate across all respondents was 47%;
- while 25% of the deals were lost to no decision and 28% of the deals were lost to the product’s competitor.

4. Average Sales Cycle Length
The average sales cycle length metric is a measurement of the average time it takes for a sales team to close a deal from the initial contact with a potential customer to the final purchase.
This metric is typically measured by tracking the time elapsed between each stage in the sales process, such as lead generation, qualification, proposal, negotiation, and close.
Formula: Total sales cycle time (in days) / Total number of deals closed (in that period of time)
Example:
Let’s say that you are the founder of a SaaS company, and you need to calculate your sales cycle length so you can forecast your Q2 sales.
In Q1 of this year, your sales team closed four deals. From first click to conversion:
Deal 1 took 40 days
Deal 2 took 30 days
Deal 3 took 60 days
Deal 4 took 70 days
To calculate your sales length cycle, you add up the total number of days it took to close every sale, then, divide that sum by the total number of deals. So, in this case:
40+30+60+70 = 200 days total.
You would then divide the total number of days (200) by the total number of deals (4) to get the average length in days.
200 / 4 = 50 days
This means that on an average, it would take 50 days to close a deal.
You can now examine your pipeline to evaluate the opportunities with high probability of becoming customers and plan your sales efforts accordingly.
Benchmark:
- The median value of B2B sales cycle length is 2.1 months. This benchmark was calculated from anonymized data from 300+ companies.

Free Google Sheet Template
Sales Performance Metrics Calculator
Customer Satisfaction KPIs
- Net Promoter Score (NPS)
- Customer Satisfaction Score (CSAT)
There are several customer satisfaction metrics that can be tracked to gauge the level of customer satisfaction with a company’s products or services.
Here are the ones that’ll give you some clue on how satisfied your customers are with your product:
1. Net Promoter Score (NPS)
Your NPS is a measure of how likely your customers are to recommend your product to someone else.
To calculate the NPS, you’ll have to run a survey to understand more about your customers by collecting their feedback, identifying the challenges they face with your product.
You will typically be asking the classic question – “On a scale of 0-10, how likely are you to recommend this company to a friend or colleague?”
The responses are then usually categorized into three groups: Promoters (9-10), Passives (7-8), and Detractors (0-6).
Formula:
NPS = (% of Promoters) – (% of Detractors)
The NPS can range from -100 to 100, with a positive score indicating a higher likelihood of customer referrals and a negative score indicating a lower likelihood. A high NPS is often seen as an indicator of customer satisfaction, brand loyalty, and positive word-of-mouth.
Example:
For example, if 50% of respondents are Promoters, 10% are Detractors, and 40% are passives, your NPS would be 50-10=40.
Benchmark:
- If NPS = 0 to 30 → Good
- If NPS > 30 → Great
- If NPS > 70 → Customers love you
- A B2B SaaS company’s NPS benchmark is typically around 40 where the data comes from a sample of at least 10,000 surveys. (Source: Retently)

2. Customer Satisfaction Score (CSAT)
One of the most straightforward ways to measure customer satisfaction is measuring the level of customer satisfaction with a product or service. This metric is called Customer Satisfaction Score (CSAT).
It is usually calculated by asking customers to rate their level of satisfaction on a scale of 1 to 10 or using a similar numerical or word-based scale.
Formula:
CSAT Score = (Number of Satisfied Customers) / (Total Number of Respondents) * 100
Sales managers use the CSAT score to gain insights into customer experience and identify areas for improvement. This metric is useful for tracking customer satisfaction over time and benchmarking performance against competitors.
Here is a range of CSAT score (in %) you could use to track yours:
0-35 very bad/highly unsatisfied
35-50 poor/unsatisfied
50-65 average/quite satisfied
65-80 good/satisfied
80-100 excellent/highly satisfied
Any score over 50% should be a good sign that your customers are satisfied with your product.
Benchmark:
- On an average, a B2B SaaS company’s CSAT score should be around 65, indicating ‘quite satisfied’. (Source: Retently)

Free Google Sheet Template
Customer Satisfaction Metrics Calculator
Customer Acquisition KPIs
- Customer Acquisition Cost (CAC)
- Customer Lifetime Value (CLV)
- Customer retention rate
- Customer churn rate
1. Customer Acquisition Cost (CAC)
Growth is positive. But growth at any cost is not acceptable. That’s why it’s wise to include Customer Acquisition Cost (CAC) as an outbound sales KPI.
CAC is an approximation of the total cost of acquiring a new customer. It generally refers to the total sum of $ spent on sales, marketing, and other activities divided by the number of customers acquired.
This is the main number you should be tracking as a sales manager. This is because if your customer acquisition cost is greater than your revenue, you’ll soon be out of business.
Formula:
CAC = Amount spent on acquiring customers / Number of customers acquired
2. Customer Lifetime Value (CLV)
Customer Lifetime Value (CLV) is a factor that predicts how much money each customer brings to your business. KPIs – Customer Acquisition Cost and Customer Lifetime Value – are often linked together.
Most businesses use the CLV to CAC ratio as a guide to look at the money spent on sales, marketing and customer service/support activities.
So, there should always be a balance between these two metrics. Meaning – the value of your customers should be higher than the cost of acquiring them.
Why CLV: This KPI can help identify the types of leads your sales team should be pursuing. Big deals with higher lifetime values result in lower operational costs and higher profits.
Formula:
CLV = Average revenue per customer x Average purchase frequency
Benchmarks for CAC, CLV, and CLV to CAC ratio for a B2B SaaS company:
| KPI | Benchmark |
| Customer Acquisition Cost (CAC) | $787 |
| Customer Lifetime Value (CLV) | $2,400 |
| CLV:CAC | 3:1 (approximately) |
3. Customer Retention & Churn Rates
Customer retention and churn rates are like two sides of a coin. Customer retention is the percentage of customers who continue to stay with you, use your product.
This metric is equally significant as you generate revenue from new customers because it directly reflects your sales team’s ability to retain customers.
Formula:
Customer retention rate = (Number of customers at end of period) – (Number of customers acquired during the period) / (Number of customers at start of the period) 100%
This metric is important for a sales manager to track because it provides insight into the effectiveness of customer engagement and loyalty strategies, as well as the overall health of the business.
Benchmark for B2B SaaS retention:
- According to SaaS Capital, benchmarking retention by Annual Contract Value (ACV) is the best starting point.
- Companies with ACVs above $25,000 show median net revenue retention of ~105%, while companies below $25,000 show ~100% median net revenue retention.

On the other hand, churn rate is the percentage of customers who unsubscribe from your product, people that are no longer interested in using your product. Increasing churn rate could mean that the customer isn’t satisfied with your product as it didn’t solve their problem, as well as competitive reasons.
Formula:
Churn rate = (Churned customers / Total number of customers) x 100
Why bother tracking this: Retaining existing customers is more cost-effective than finding new ones by spending on random XYZ experiments. Therefore, most businesses monitor this KPI closely, especially start-ups.
Benchmark:
- According to Baremetrics after analyzing over 600 small-to-medium sized SaaS companies, the churn rate in these companies were found to be 7.5% on an average. (losing revenue anywhere from $100-$250)

Free Google Sheet Template
Customer Acquisition Metrics Calculator
How to make sense of these KPIs & how to choose the right ones
Remember the good old outbound days? All it took was a trusty “spray and pray” approach and persistence to close a decent number of deals. But now, with all these fancy tools, it feels like outbound sales has become a labyrinth of complexity.
But outbound sales can still be mastered with a little bit of creativity and the right strategy. Precision targeting, multi-channel outreach with relevant messages, and more will help us sales superheroes soar. But the question remains: are we doing it all to the extent of our ability?
Enter the KPIs. This list isn’t exhaustive, but it’s a helpful starting point for tracking your sales success. There could be more that your business needs, so don’t be afraid to delve deeper.
When you have identified the KPIs, it’s important to align them with your goals, measure your performance, and take appropriate actions to improve.
Part of the team at Salesgear, sharing what actually works in modern B2B outbound: research-led personalization, deliverability, and multichannel sequencing.